

On Christmas Eve 2024, the driver of an SUV barreled down the 1500 block of C Street NE at high speed, lost control, struck the curb and killed Ronnie Clark, 66, a former Marine who had lived in Hill East for more than 20 years. The driver got out and ran. Nineteen months later, no one has been arrested.
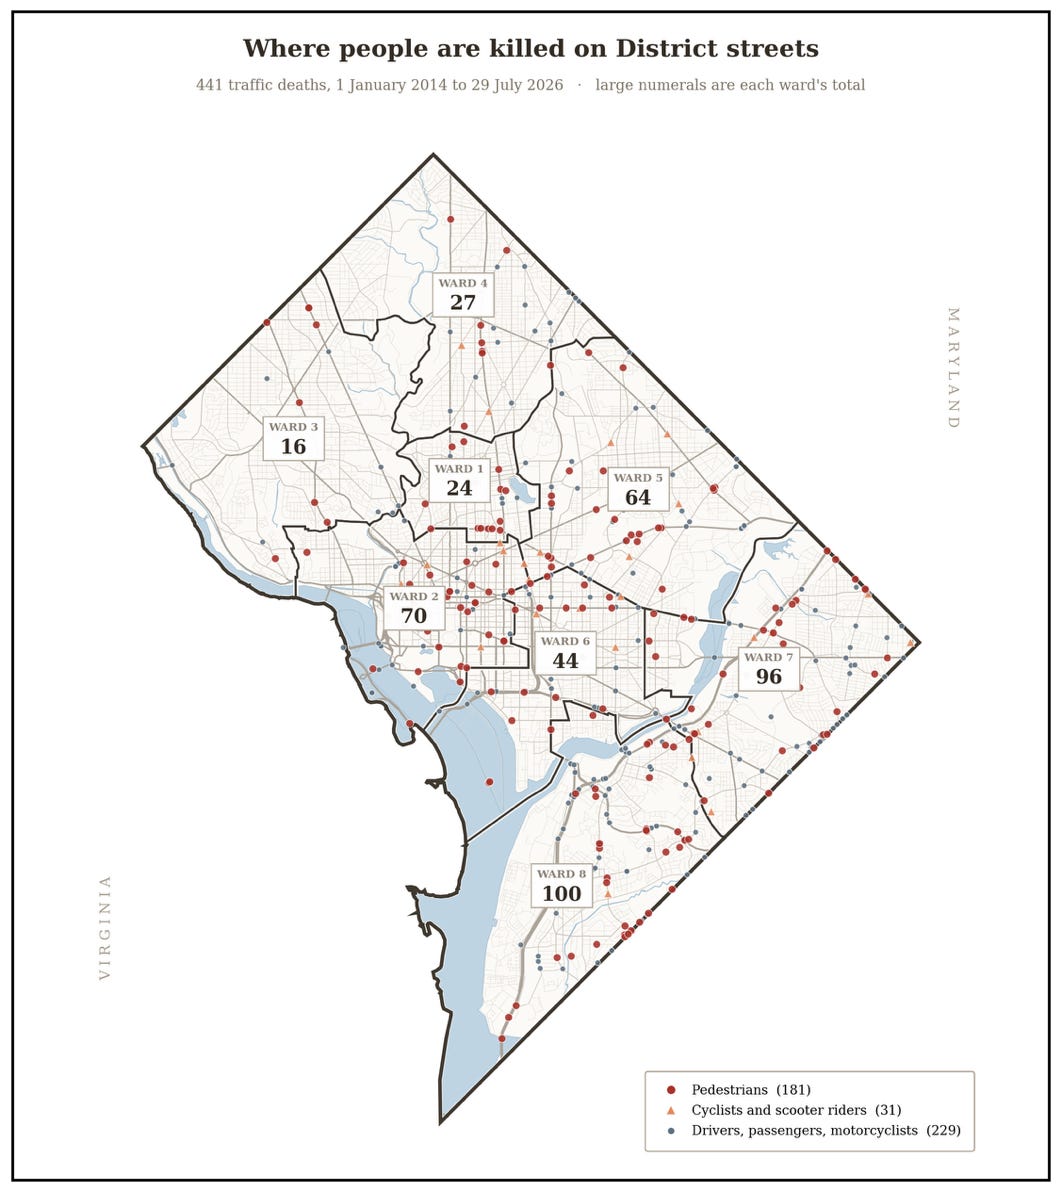
Figure 1. Every D.C. traffic death from 1 January 2014 to 29 July 2026 (441 in total). Numbers give each ward’s total. Wards 7 and 8 account for 196 deaths, 44% of the total on 25% of D.C.’s population. Sources: DDOT Vision Zero Crash Injury Point layer, D.C. GIS.
Clark was one of 21 pedestrians or cyclists killed in traffic accidents in 2024, and one of 52 total traffic fatalities that year. His death was also a violent prelude to what was supposed to be our first year of zero traffic fatalities.
In 2015, Mayor Muriel Bowser set a goal of eliminating traffic deaths in 10 years as part of “Vision Zero,” launching a series of investments in infrastructure and other initiatives meant to protect D.C. residents. The street Clark was killed on is a showcase of that effort: it had been recently redesigned – at a cost of almost $23 million – to slow traffic and create barriers meant to protect pedestrians and cyclists.
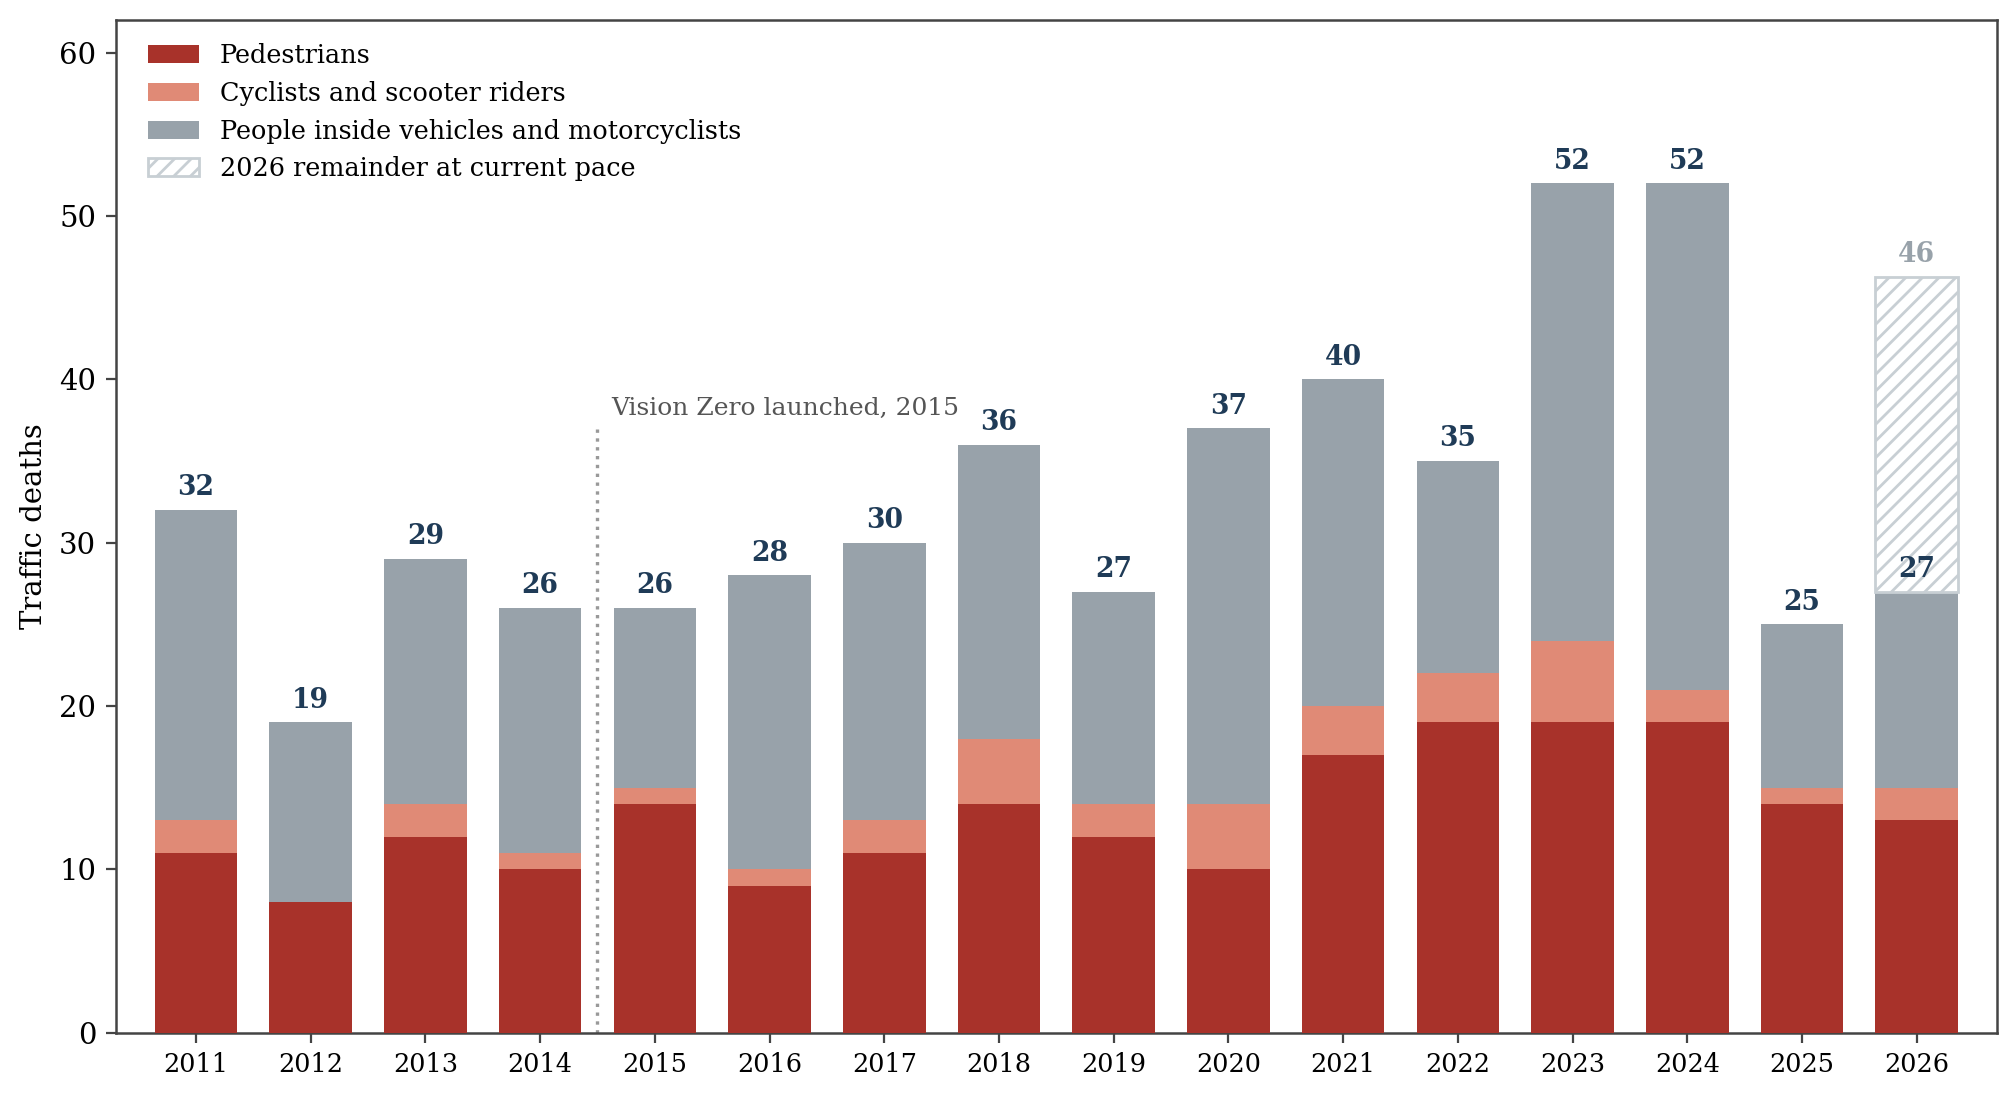
Figure 2. Traffic deaths by mode, 2011 to 2026. The 2026 bar is split: the solid portion is the 27 deaths recorded through 29 July, on pace for 46 by the end of the 2026. Sources: MPD published traffic fatality counts, DDOT Vision Zero Crash Injury Point layer.
2025 offered some relief. Fatalities fell by half, even if pedestrians bore the brunt. It appears to have been an anomaly.
This year is shaping up to be as bad as 2024: through 29 July, traffic deaths more than doubled compared to last year. Six pedestrians and cyclists were killed in July alone. And based on insurance claims, D.C.’s drivers are now the second worst in the country. It’s clear the current strategy isn’t working.
The data tell the story in three parts:
First, dangerous driving in the District – defined here as excessive speeding – has grown dramatically over time. We can see this by looking at speed camera data, where the share of tickets for more severe violations has doubled over a decade.
Second, dangerous drivers face few consequences. Despite recent efforts to crack down on the most egregious speed camera ticket scofflaws, many tickets continue to go unpaid. For excessive speeding violations, non-payment is worse. More concerning: active police enforcement of traffic laws has fallen off a cliff. Moving violations issued by D.C. police are at their lowest level in 15 years.
Third, the costs of traffic violence are disproportionately borne by the poorest parts of D.C. –Wards 7 and 8 – where the data suggest the “dangerous driving – no consequence pattern” is the worst.
Vision Zero was supposed to prevent this. It is likely that absent the infrastructure improvements and speed cameras, we may have seen even more death and destruction, but until D.C. gets serious about taking dangerous drivers off the road, people will continue to die.
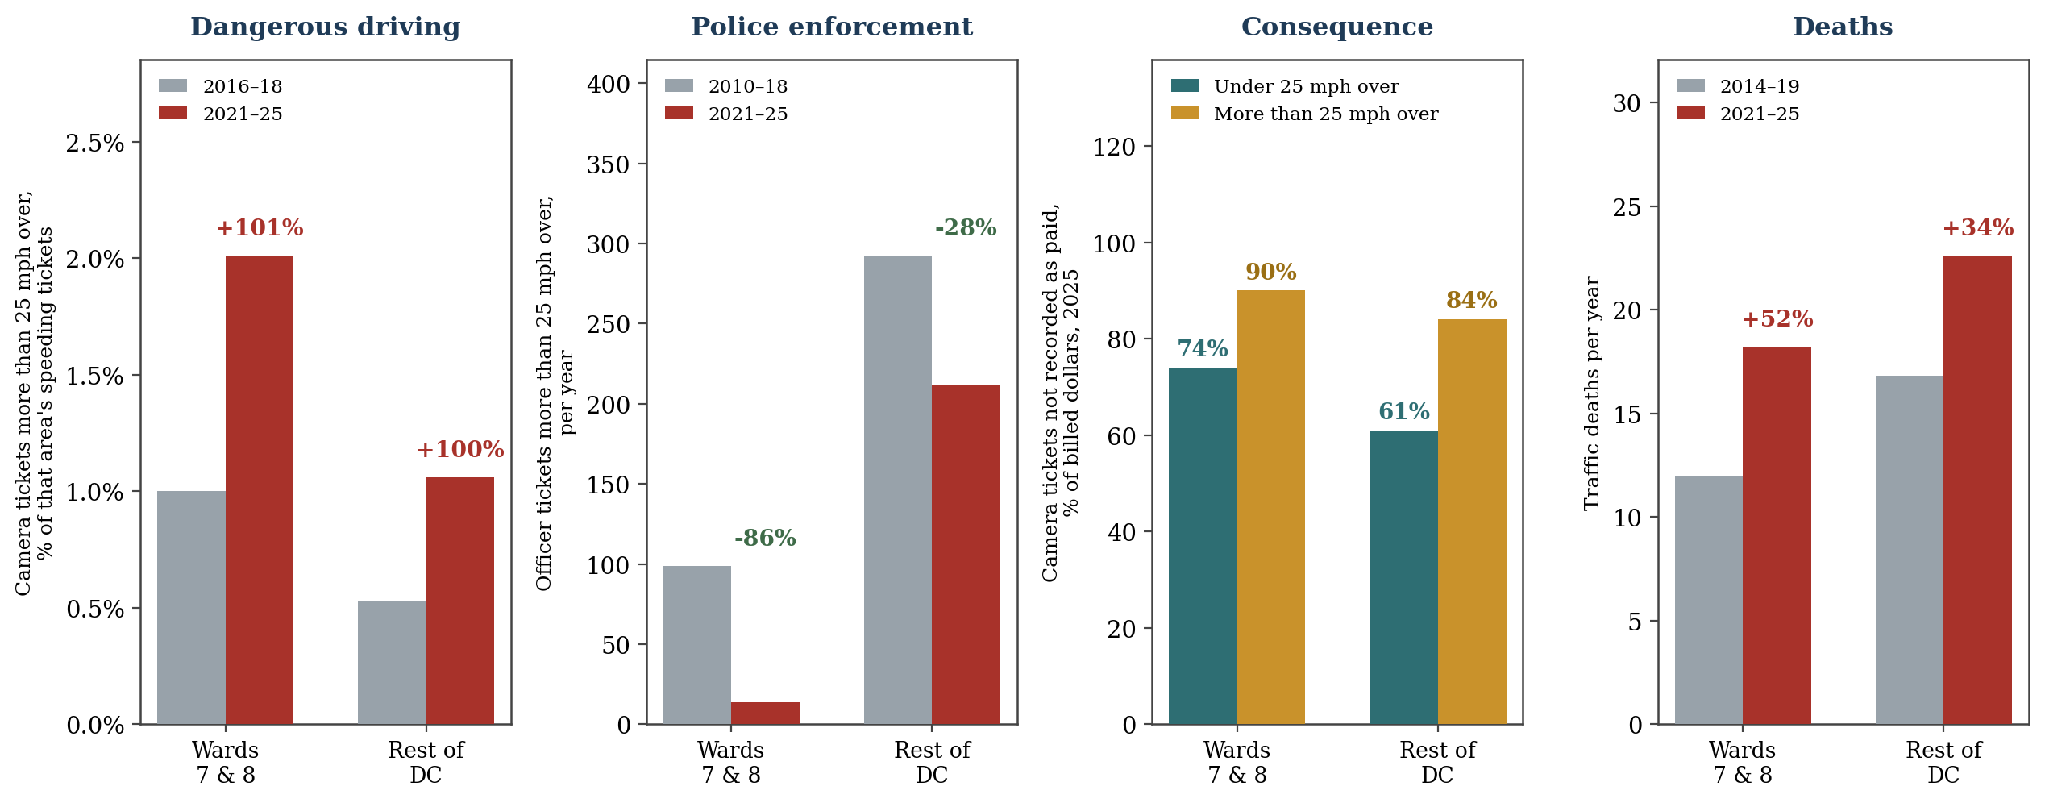
Figure 3. Dangerous driving is up, police enforcement of severe speeding is down, the most dangerous drivers avoid paying camera tickets, and deaths are rising. Severe speeding is twice as common east of the river. Ticket payment rates are higher than shown because of data lags, but geographical and severity trends are directionally correct. 2019 is excluded from the enforcement panel because of coding changes. Sources: D.C. Open Data, DDOT Vision Zero.
The good news is that our incoming mayor has an opportunity to chart a new, safer course, and many of the necessary reforms and policies depend more on political will than new budget requests.
Vision Zero Investments Are Real, Yet D.C. Roads Are More Dangerous
D.C. has invested heavily in physical infrastructure to address road safety and pursued other reforms that, in theory, should have helped prevent deaths.
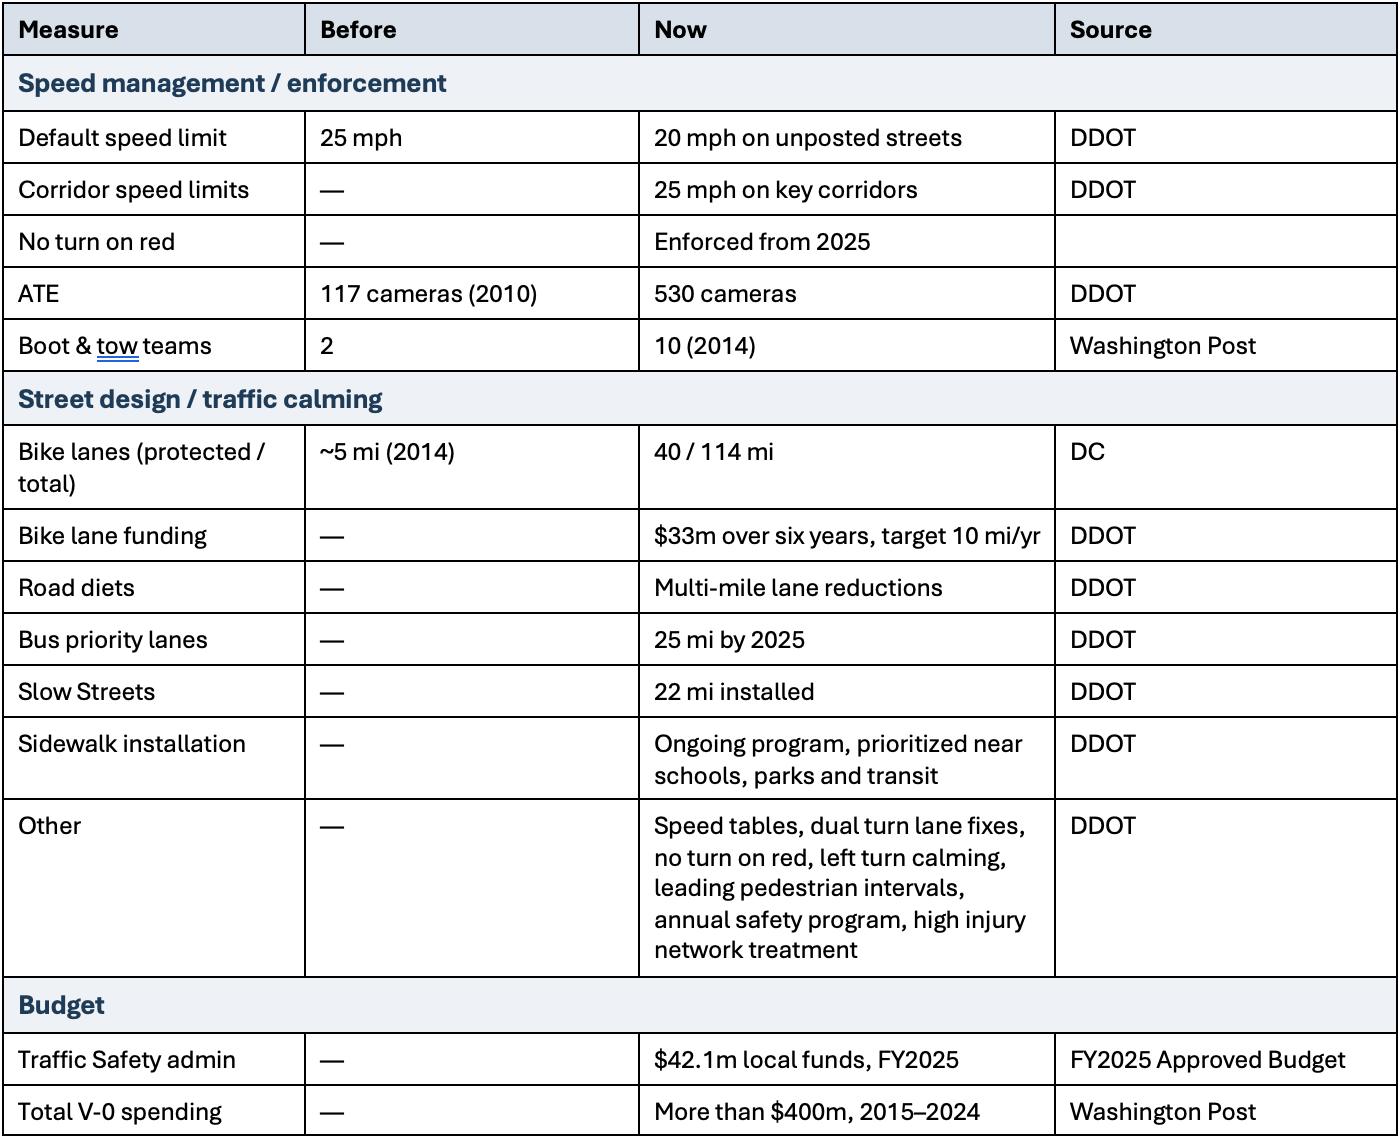
Table 1. Vision Zero-era build-out.
From bike lanes, to lowering the default speed limit in 2020, to a massive expansion of the network of automated traffic enforcement (ATE) cameras, D.C. has invested heavily in improving road safety. And it’s been expensive – more than $400 million total between 2015 and 2024, according to the Washington Post.
And yet, traffic deaths are up. It’s true that the country experienced a surge in pedestrian deaths post-pandemic, but nationally, US pedestrian deaths have fallen for three straight years. Meanwhile, D.C.’s traffic violence continues to take too many lives.
Is this just a natural result of D.C.’s population and traffic growth? No. On a per vehicle mile traveled basis, both total traffic fatalities and pedestrian/cyclist fatalities nearly doubled from 2014-2023, the latest year for which VMT estimates from DOT exist.
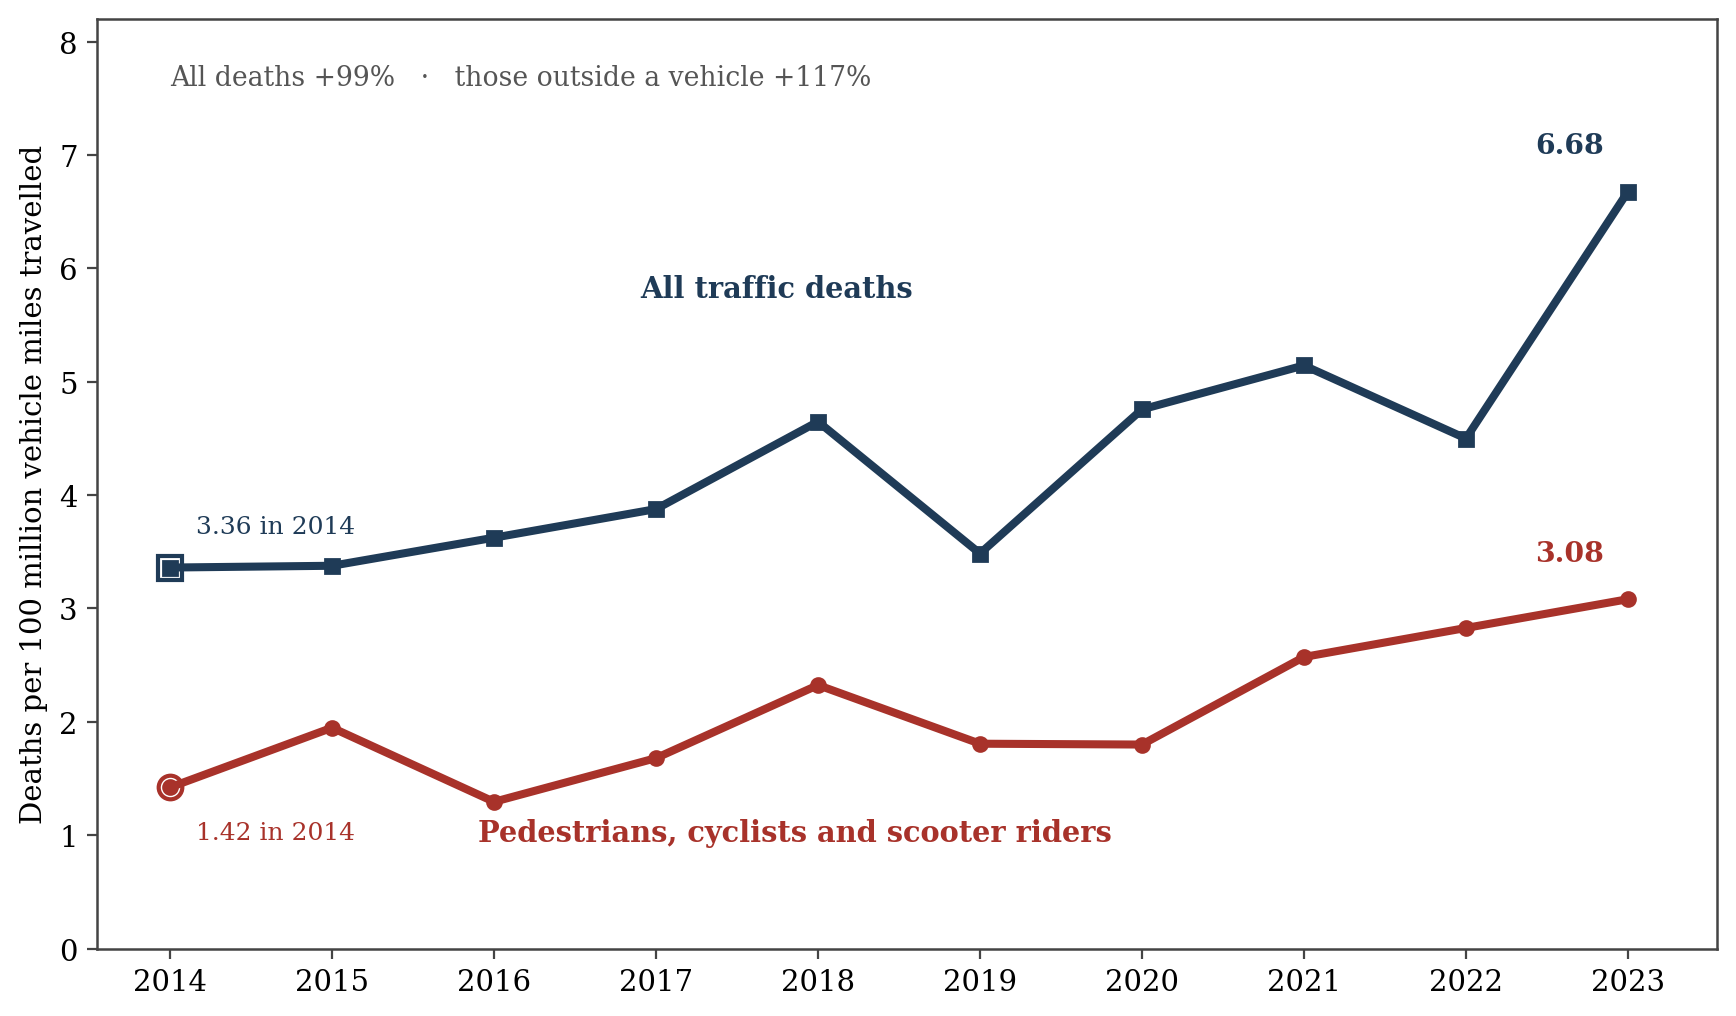
Figure 3. Traffic deaths per 100 million vehicle miles travelled, 2014 to 2023. All traffic deaths rose 99% per mile driven; deaths of pedestrians, cyclists and scooter riders rose 117%. Sources: D.C. Government, FHWA Highway Statistics Table VM-2.
A greater number of large vehicles also doesn’t help. Light trucks and SUVs are involved in just over half of US pedestrian deaths, and the Insurance Institute for Highway Safety finds they are more likely than cars to kill a pedestrian at the same impact speed. D.C.’s fleet shifted the same way, but the shift is mis-timed and gradual. Bigger vehicles are making crashes more lethal everywhere, but it’s not the whole story in D.C.
Speeding is Dangerous for Pedestrians – And More Common in D.C.
The risk of a pedestrian dying from a collision with a vehicle increases exponentially with speed. At 23 mph, that risk is about 10%. At 42 mph, about 50%. And at 60 mph more than 9 of 10 pedestrians will die.
We know that speeding kills; a 2014 study found that drivers who accumulate traffic tickets are more likely to be involved in crashes, the risk growing with the number of tickets. But how do we measure speeding? In D.C., we can look to the sprawling network of ATE cameras for insights into how drivers are behaving. The result? Excessive speeding – defined here as the share of tickets issued for exceeding the posted speed limit by at least 25 mph – has become far more common, up between 92% and 126% between 2016–18 and 2021–25.
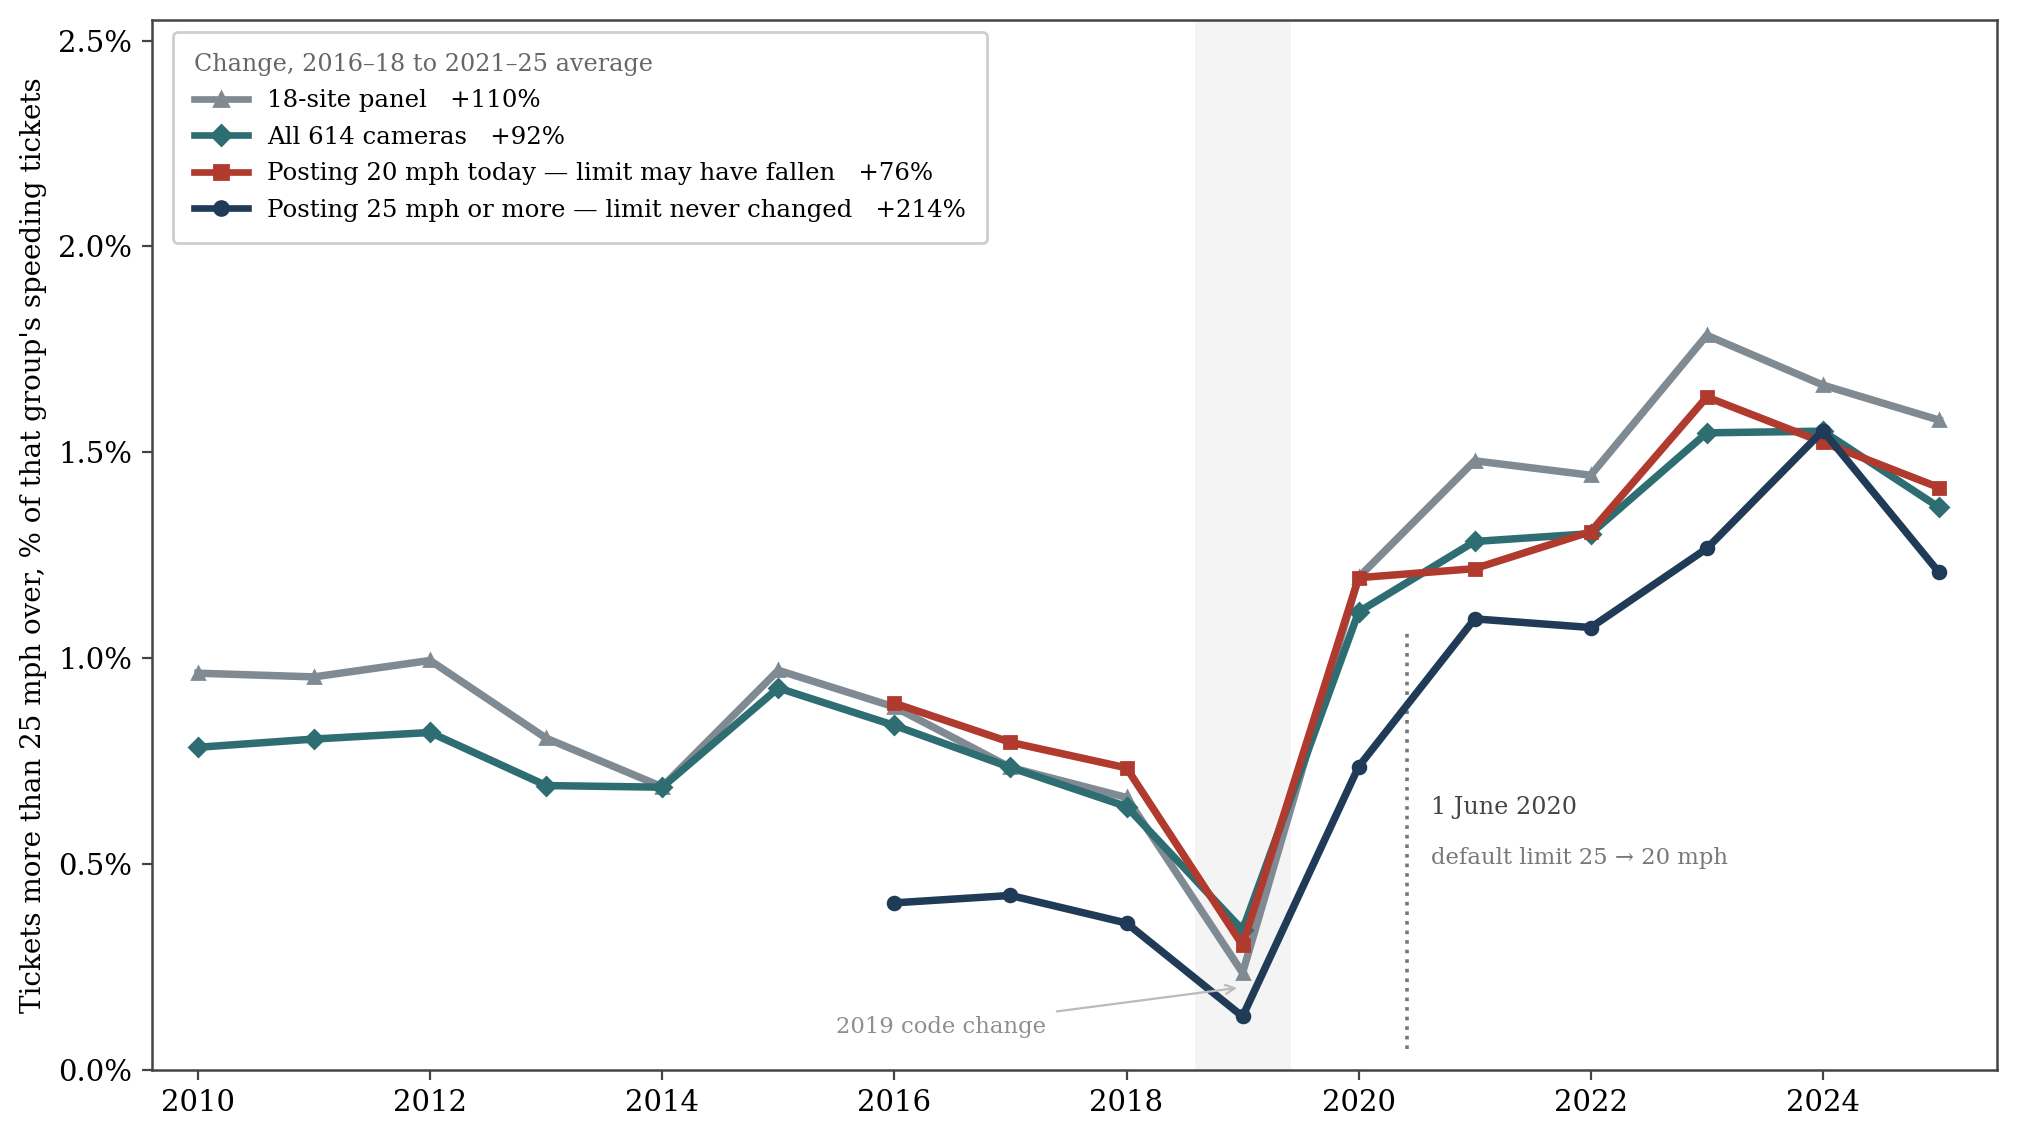
Figure 4. Share of tickets for more than 25 mph over the posted limit. The top series includes 18 cameras that have been in place since 2010. The second series is all cameras; some retired, some added. The two lower series show that the trend is not sensitive to the 2020 unposted speed limit change from 25 to 20 mph. Sources: D.C. Open Data, D.C. GIS. Camera locations matched to posted speed limits.
In D.C., Camera Tickets a Poor Deterrent
Despite dangerous speeding being more common, drivers face a low likelihood of any real consequence. D.C.’s ATE network was advertised as a safety measure, and it has grown accordingly, from 117 sites in 2010 to 223 today. Research suggests cameras can deter dangerous driving. When Ontario banned ATE in 2025, speeding — captured by the now-neutered camera network — increased. In the D.C region, the evidence is less clear. A 2024 Washington Post analysis found D.C.’s cameras cut crashes in their immediate vicinity. Elsewhere? Not so much. But speed cameras are only a deterrent insofar as there are consequences. Unlike in the United Kingdom, camera tickets in the U.S. generally don’t result in license demerit points. In D.C., no accumulation of camera tickets, at any speed, in any quantity, can lead to license suspension or other sanctions.
And in D.C., even financial penalties are hard to extract.
Much has been written about the inability of the D.C. government to collect fines from drivers who accumulate ATE violations. Data suggest more than 30% of all camera tickets are never paid, and the number is above 50% for non-residents. The 2024 STEER Act authorized the D.C. Attorney General to sue out of state drivers who owe unpaid fines. As of March, OAG has secured judgements against 15 of the most egregious speeders totaling more than $608,292, in fines, penalties and fees. Hundreds of thousands of dollars have also been recovered by seizing scofflaw vehicles. But litigation and towing are tedious and time-consuming. Meanwhile, tens of thousands of drivers have racked up more than $1 billion in unpaid tickets.
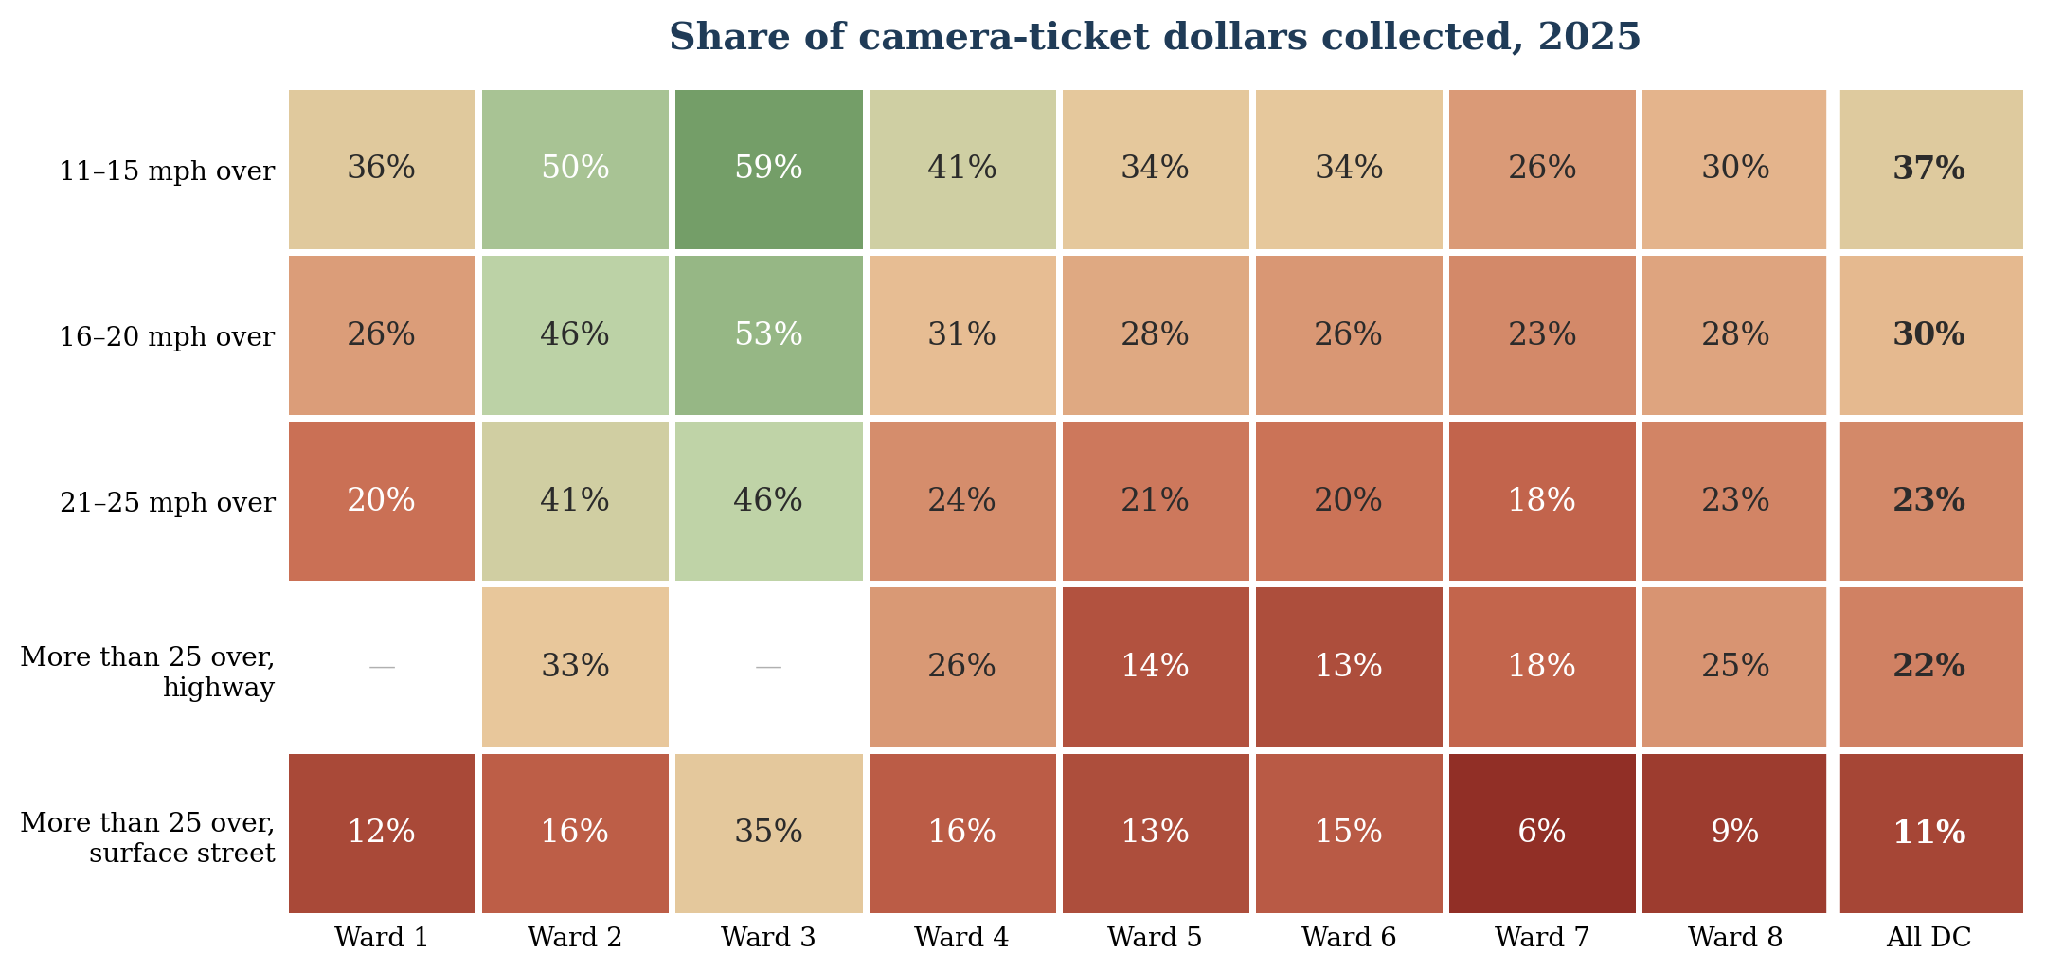
Figure 5. Share of camera-ticket dollars collected in 2025, by ward and severity. Actual collection rates are uniformly higher as data are not updated regularly, but differential patterns are likely to persist. Source: D.C. Open Data, Moving Violations. Recent data are available here.
D.C.’s ATE data also show that the most dangerous drivers are less likely to pay their tickets; payment rates for the most egregious speeding violations are about a third of the payment rates for the mildest violations. And payment rates are lowest in Wards 7 and 8, where violations are the most severe. Until there is a more efficient and effective way to compel payment, many dangerous drivers will continue acting with impunity.
Police Enforcement Has Fallen Off A Cliff
Unlike camera tickets, officer-issued tickets come with real consequences. A driver who receives three officer-issued tickets for driving 21 mph over the posted speed limit in a 24-month period risks losing their license. A driver cited for aggravated reckless driving – 30 mph above the posted limit – can lose their license immediately.
The problem? Officers have all but stopped traffic law enforcement.
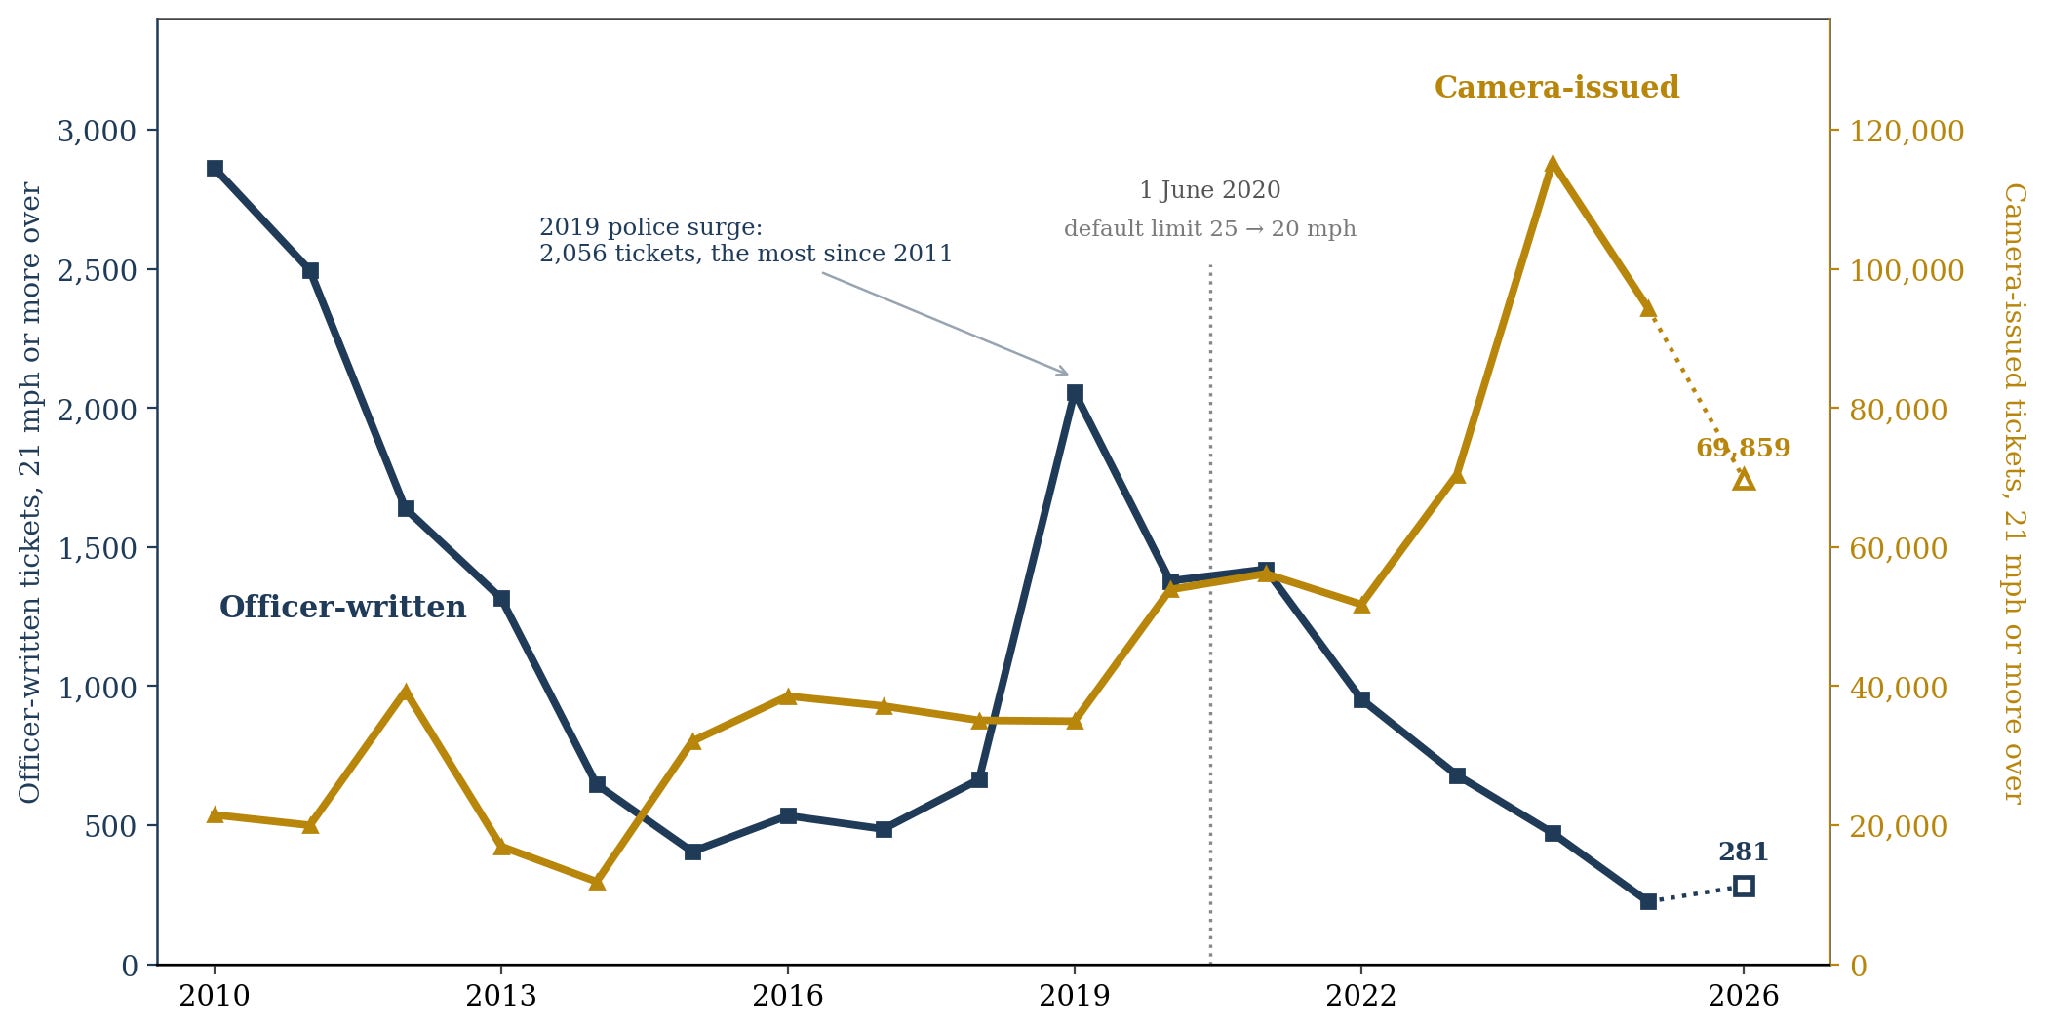
Figure 6. Tickets for 21 mph or more over, by issuer. This chart uses 21+ rather than the 25+ threshold used elsewhere because of code changes in 2019. Dashes are 2026 pro-rated from five complete months to 31 May. Includes citations from all local and federal police agencies. Source: D.C. Open Data.
Officers issued about 2,700 tickets per year in 2010 and 2011 and averaged 1,310 a year across 2010-2019. In 2025 they issued 225. Enforcement also changed character over time, becoming more reactive. In 2019, 9.4% of officer-issued violations involved a crash, presumably as part of the process of assigning blame. In 2025, that share rose to 15.9% – less proactive enforcement.
Some of this is likely due to the outsourcing of traffic enforcement to cameras. But police enforcement of traffic laws is also a contentious and politically charged issue.
The Washington Area Bicyclist Association, for instance, is opposed to armed traffic enforcement based on concerns about racial profiling and increased risks of fatal police encounters. They point to a 2021 study of state-patrol stops that found no association between greater police enforcement and crash rates. But state patrols tend to enforce highway traffic, not urban areas like D.C. More than 80% of the crashes in that study were in rural areas. A more relevant study from 2014 looked at the impact of a well-publicized enforcement campaign in Massachusetts, finding that greater enforcement reduced crashes.
The status quo in D.C. is bad news for traffic safety. Cameras that fail to deter the most dangerous drivers, and limited law enforcement backstop.
When Pedestrians Die, It’s Hard to Hold Drivers To Account
Consequences for dangerous drivers who take lives are also not certain. D.C. does not publish data on the share of traffic deaths that result in charges or convictions, but anecdotes and national data suggest serious charges are rare – if an offender is identified.
Only about half of hit-and-run drivers are ever identified. The driver who killed Ronnie Clark is in that category. Roughly one pedestrian death in five is a hit-and-run.
Even when these drivers are identified, they are often able to avoid serious sanction. For instance, in 2018, 68-year-old cyclist Thomas Hollowell was killed on his bike near the National Mall by a driver who ran a red light and fled the scene. The driver was eventually identified and convicted of involuntary manslaughter, but sentenced to only 18 months in jail – the longest term available given the charges.
Part of the problem is the difficulty of building cases when drivers flee the scene. Officers must not only find the vehicle, but also establish that a particular person was behind the wheel. The July arrest of a woman for an April hit-and-run in Foggy Bottom is illustrative. An accompanying, 112-page affidavit lays out in meticulous detail the two-month process by which officers linked the driver to the crime, using a compilation of dozens of traffic and private cameras and witness interviews.
For drivers, the incentive to flee is high. Since 2013, D.C.’s criminal code allows for a maximum 6-month jail sentence for drivers charged with “leaving after colliding.” Other charges can be stacked, but the incentive is clear – run, and it will take months for investigators to build a case. If they ever find you.
Wards 7 and 8 Take the Brunt
Calls for more police enforcement of traffic laws are not popular, and we shouldn’t discount the risks that come with more police interactions. But the disparate impact of traffic violence must be part of the conversation. Analysis of national trends reveals a racial gap in traffic deaths, especially when it comes to pedestrians. In D.C., wards 7 and 8 are majority black and poorer than their west-of-the-river counterparts and are home to a disproportionate number of traffic fatalities.
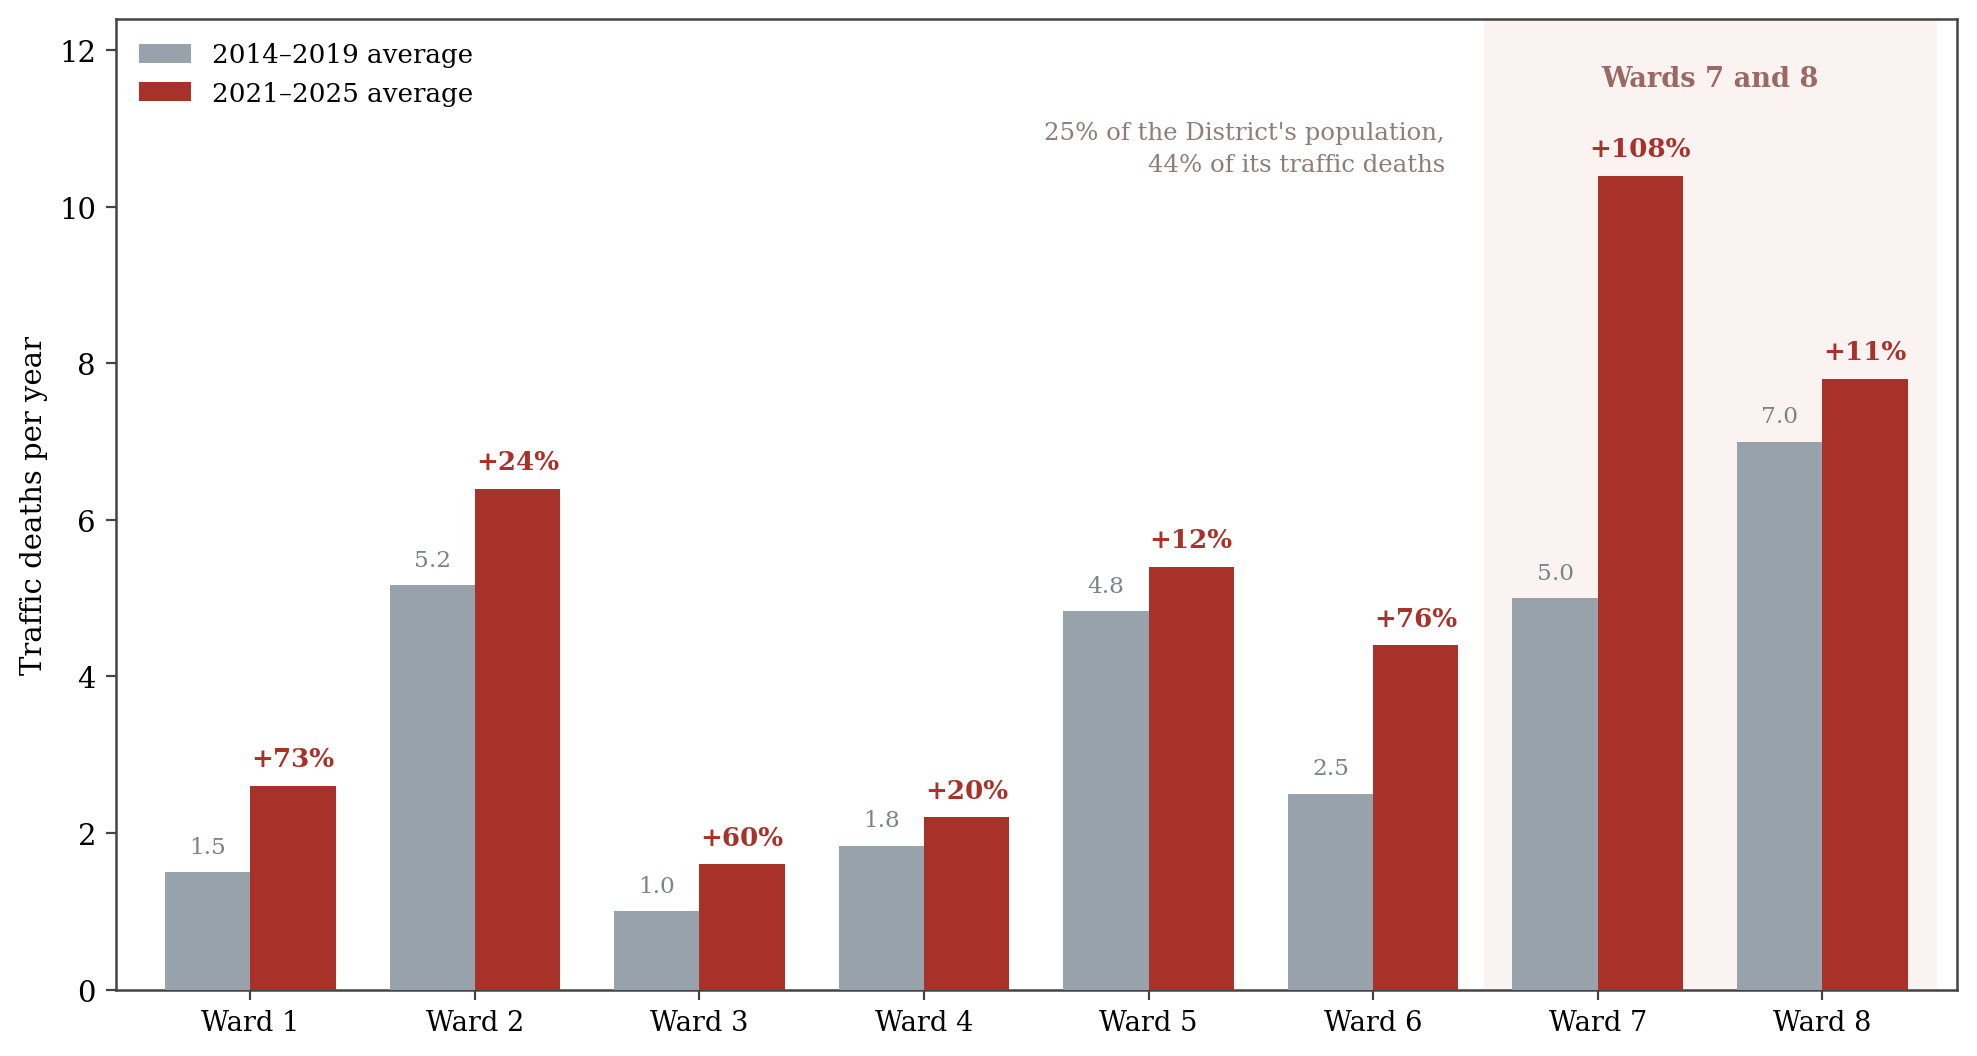
Figure 7. Traffic deaths per year by ward, before the pandemic against the five most recent full years. D.C. draws its wards to roughly equal population. Source: DDOT Vision Zero Crash Injury Point layer.
As illustrated in Figure 3, this disparity has grown over time. Compared to the city as a whole, wards 7 and 8 have higher rates of excessive speeding, lower camera ticket payment rates and saw a greater drop-off in police enforcement of traffic laws.
Every death is a tragedy, but it’s worth putting this problem into perspective. In the decade from 2015 to 2024, 30 people were shot and killed by police across the city.1 During the same period, 171 pedestrians, cyclists and scooter riders died from traffic violence, 61 of them in wards 7 and 8 alone.
What to Do
The next D.C. mayor has an opportunity. It’s true D.C. is facing a difficult budget situation and massive new capital improvements focused on road safety are unlikely to be fiscally possible. The good news is there are many low-cost and even revenue-increasing reforms that would likely have a real impact.
Laws and coordination with Maryland and Virginia
Finalize reciprocity. Maryland Senate Bill 173 would authorize Maryland to enter reciprocity agreements. Once such an agreement is in place, Maryland could refuse registration to a driver delinquent on D.C.’s camera tickets, the same rule applying to D.C. drivers who ignore Maryland tickets. The bill takes effect 1 October if passed. A similar agreement with Virginia should be a priority while the Governor’s office is held by a Democrat. Collecting unpaid fines from non-D.C. residents is both a safety and budget imperative.
Stiffen leaving after colliding. The maximum sentence for fleeing a crash resulting in an injury is 180 days, and sentences may run concurrently with other charges. Requiring consecutive sentencing would reduce the incentive to run. Better yet? Make it a felony to leave the scene of an accident that results in a serious injury.
Extend intelligent speed assistance beyond reckless-driving convictions and consider it for dangerous driving caught on camera. D.C.’s STEER Act was the first U.S. law to mandate speed limiters for repeat offenders.
Camera enforcement
Continue with lawsuits. The Attorney General has won judgments. Publicity around lawsuits likely serves as a deterrent to excessive accumulation of tickets, even if litigating one driver at a time is not scalable.
Use the STEER Act escalation ladder. The STEER Act created a vehicle points system under which ten points in six months makes a vehicle eligible for booting and towing, and DPW has gone from two boot teams to ten as of 2024. Expand the teams, and consider citizen reporting as a means for identifying the worst offenders.
Revisit Clean Hands exemptions. Under the Clean Hands Act a license can be withheld from an applicant owing the District more than $100, but reforms introduced earlier this decade excluded debts to the D.C. DMV – including camera tickets. It is important to have some discretion to avoid shutting down businesses, but egregious violators should not be afforded this loophole.
Enforce D.C. vehicle registration requirements to improve collection. Virginia lets non-residents register vehicles there, and about 14,000 D.C. drivers hold Virginia tags. Of the 103 most-ticketed vehicles in FY2025, 67 carry Virginia plates and 25 Maryland. D.C. already requires residents to register vehicles in D.C. It should pass a law that imposes stiffer penalties for D.C. residents who drive dangerously while operating out-of-state registered vehicles absent a qualified exception.
Attach license demerit points above a camera ticket severity threshold. This is difficult and without obvious precedent in the U.S., but other countries do it. This sanction should be reserved for the worst offenses. Such a move would likely require legislation and technical improvements to existing ATE cameras to accurately identify drivers.
Police enforcement
Increase enforcement of traffic laws. Ticket-writing has all but disappeared. Enforcement campaigns and regular enforcement shifts will help fill gaps in the camera network and ensure the most dangerous drivers face actual penalties.
Charge reckless driving at the statutory threshold. D.C. law defines reckless driving as 20 mph or more over the limit; aggravated kicks in at 30 over. Very few non-criminal reckless driving citations are filed in D.C.
Assess performance of MPD district commanders. This does not mean ticket quotas, but rather outcome-based assessments. D.C. already runs CompStat-style accountability on crime; traffic injuries and deaths belong in the same review.
Publish a traffic injury and fatality disposition dashboard, and clearance rate when charges are pursued. More information will help D.C. residents and advocacy organizations hold elected officials and agency heads accountable.
D.C. has spent a decade working toward Vision Zero, with little to show for it. The next mayor has a chance to chance course, and make the city safer for all of us.
Methodology and Appendix
Fatalities come from DDOT’s Vision Zero Crash Injury Point layer, a person-level record in which each row is one person killed, carrying mode, ward, date and coordinates. It is the only D.C. source that identifies who died rather than how many, and it reconciles with MPD’s published annual totals in every year from 2011 to 2025. Counts run to 29 July 2026 and the layer lags roughly two weeks. Enforcement comes from D.C. Open Data’s Moving Violations file, pulled for all 197 months from January 2010 to June 2026 (about 25 million citations).
The violations file does not say whether a human or a camera issued a ticket, so issuer is inferred from four signals that agree with one another: presence of a driver’s date of birth (93-99% on human-issued agencies, 16% on the two camera agencies), presence of a license state, the M-versus-I value in the violation type field, and disposition codes that only a camera can generate. Officer counts include MPD districts plus federal and other human-issuing agencies. Severity is measured by violation code; a consistent “more than 25 mph over” series is T122 plus T123 before August 2019 and T822 plus T823 after, when D.C. retired the older codes. That changeover makes 2019 unusable for the higher band, so 2019 is excluded from comparisons that use it, and analysis of officer enforcement uses the 21-mph-and-over band, which spans the change and is also the threshold at which license points attach.
Ticket payment cannot be compared across years: D.C. freezes each monthly extract when it is exported and the lag varies, so a ticket paid after export still reads as unpaid. Collection rates in this piece are therefore within a single year, where every cell shares one measurement window, and true collection is higher than the figures shown.
Appendix
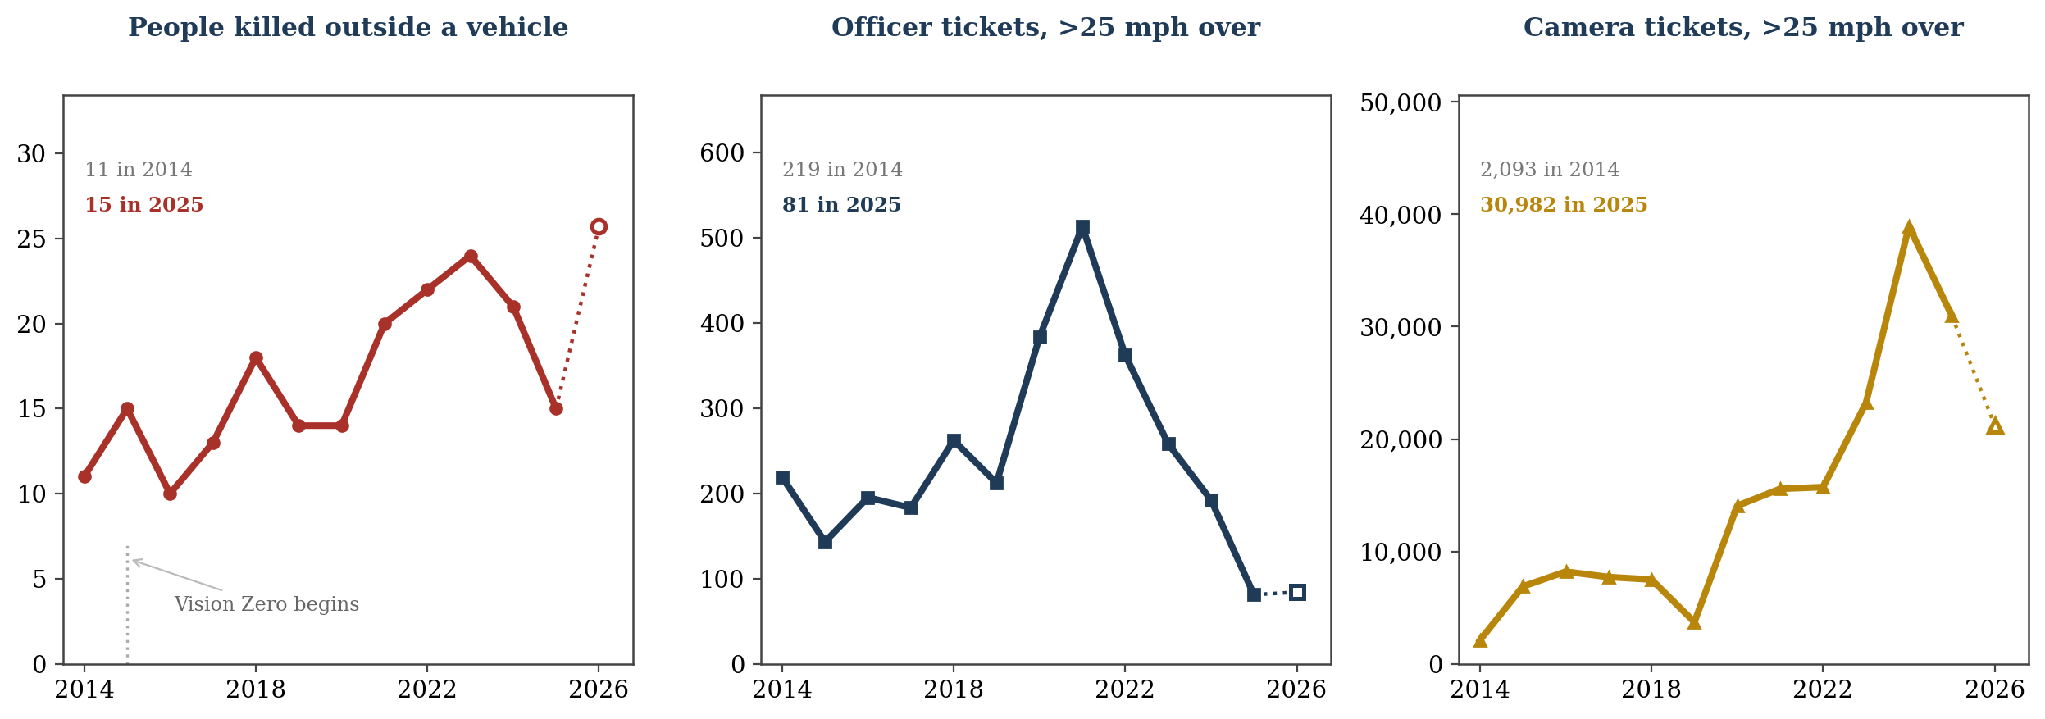
Figure A1. Deaths, officer tickets and camera tickets. Open markers are 2026 at the current pace. Sources: DDOT Vision Zero Crash Injury Point layer, D.C. Open Data.
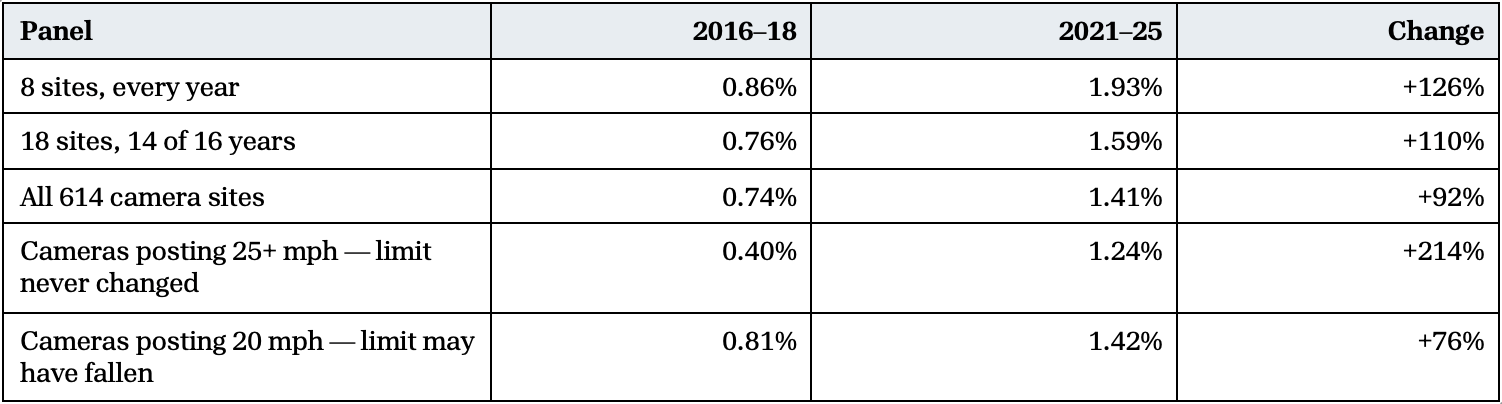
Table A1. Share of tickets for 21 mph + over the posted limit. D.C.’s camera file carries usable coordinates only from 2016, so the two speed-limit rows cannot be built earlier. 2019 is excluded from every comparison because of a coding change mid-year. Speed limits are DDOT’s current posted values.
Note: We updated several typos. The earlier version of this article read “with the same rule applying to Maryland drivers who ignore D.C. tickets” and now reads “with the same rule applying to D.C. drivers who ignore Maryland tickets.” Another repeated prose. We also moved a reference to an Israeli study about ticket accumulation up in the text.
Of the 30, three were unarmed. These figures do not include other deaths attributed to police interactions (i.e., resulting from other type of force or vehicle pursuits).

I have personally been hit by cars twice and also personally know two people with more than $10k in unpaid fines. Deeply related phenomena. Traffic laws are meant to be enforced and are non-euphemistic instantiations of “public safety”.
The police do not enforce traffic laws here. Like, at all. I've seen people doing things in front of the police that would get them arrested in Virginia and the cops straight up do not engage. It feels so intentional to me that it must be an unofficial policy from the mayor's office or MPD. I would be interested to understand the rationale.